Driving Subscriber Growth: How to Transform Subscription Marketing into a Profit Engine
Master the art of subscriber acquisition growth with our comprehensive guide. Discover how to leverage detailed cohort analysis to enhance your subscription marketing’s profitability and efficiency.
This guide is designed to teach you how to methodically examine and understand the lifetime value and profitability of subscribers based on their acquisition source, not only sharpen marketing program effectiveness but also enhance your business’s financial health.
Are you monitoring the effectiveness of your subscriber acquisition strategies? Is your team adept at identifying the value each subscriber adds to your business, based on how they were acquired and their retention period?
Recognizing the profitability of a subscriber sourced from a television campaign versus one through pay-per-click (PPC) can revolutionize your marketing investments. This intelligence goes beyond customer acquisition costs (CAC), it understands the full value of each subscriber’s lifetime subscription spend with your business. The real game-changer lies in reallocating funds intelligently across various channels based on these insights, investing more or less per newly acquired subscriber, and ensuring each marketing avenue yields profitable subscribers.
Our initial discussion in the “Decoding Cohorts” series covered an overview of cohort analysis. Now, we delve deeper into utilizing cohort analysis to enhance the profitability of subscriber acquisition. This approach is crucial for scaling subscription businesses effectively without squandering marketing budgets. Key to this process is understanding the full LTV profitability by acquisition source and then using that insight to adjust how much you spend per subscriber to acquire them through that source. However, the ease of accessing this vital data hinges on your technological infrastructure.
Understand Technology Reporting Capabilities
Let’s chat about technology—your business’s Subscription Technology Stack (SubTechStack), to be exact. Depending on your business’s setup, creating these cohort reports will be straightforward, super easy, or unfortunately, hard. When we talk about SubTechStack, we’re referring to the various tools and platforms employed in marketing, subscriber management, analytics, etc. Some systems facilitate the seamless integration of marketing data with comprehensive subscriber lifetime value analytics, while others might not be as accommodating.
It’s crucial to get acquainted with your tech landscape. If your system already marries marketing and subscriber data effortlessly, you’re poised to refine your marketing campaigns with precision. If not, don’t fret! There are workarounds like crafting unique landing pages or using promotional codes that can help bridge the gap. The goal is simple: ensure every piece of data from your acquisition channels can be traced back to your subscriber’s journey and total economic value to your business to inform smarter marketing investment decisions.
Why Subscriber LTV Acquisition Analysis is a Game-Changer
Understanding the full profitability of each acquisition source through cohort reporting isn’t just a task; it’s a strategic asset. Imagine empowering your marketing team with precise knowledge of how much can be spent to acquire each subscriber while ensuring profitability aligned with your margin goals. This isn’t about spending less but spending smartly, ensuring every marketing dollar spent contributes to sustainable growth.
Regularly analyzing subscriber acquisition profitability—whether monthly, quarterly, or annually—is essential not just for maintaining but significantly enhancing the health and vitality of your subscription business. It bridges the crucial gap between marketing efforts and financial outcomes, enabling a synergistic approach to achieving profitable growth.
Undertaking this analysis might seem daunting at first glance, but the dividends it pays in actionable insights are immense. By utilizing accessible tools like Excel and adopting a systematic approach, you can demystify subscriber data, transforming it into a powerful guide for strategy refinement and business growth.
Remember, the initial setup is just the beginning. Once you grasp the fundamentals and get started, you’ll have the freedom to tailor your reports to the unique dynamics of your business. Whether adjusting the frequency of your reports or focusing on specific cohorts based on acquisition sources, you can tailor an approach that ensures your analysis remains as relevant and impactful as possible.
In essence, the effort you put into cohort analysis and acquisition source profitability reporting is an investment in your business’s future. It equips you with the knowledge to make informed decisions, ensuring that your subscription business doesn’t just grow, but flourishes with profitable, engaged subscribers. This is why diving deep into cohort analysis isn’t just important—it’s indispensable for any subscription business committed to long-term success and profitability.
Step 1: Data Collection and Preparation
The important step of standardizing data is crucial for reliable results.
Collect Your Data: Begin by compiling data for each of your subscribers. You’ll need their sign-up date (to track when customers begin contributing $$ to the business), the promotional source from which they discovered your service (to identify effective marketing channels), their monthly payment amount (to calculate revenue from each subscriber), and the date they canceled their subscription, if applicable (to measure how long subscribers stay, affecting lifetime value). Pull in all your subscribers here and plan to add and update over time ⸺ monthly, quarterly, annually ⸺ based on your business needs.
Example: John Doe signed up on January 1, 2023, via a Google ad, pays $10 monthly, and hasn’t canceled.
Normalize Your Data: Standardize all your data to ensure consistency. Use the same format for dates (e.g., MM/DD/YYYY) and financial figures (ensure all are in the same currency and decimal places).
Example: Standardize all sign-up and churn dates to MM/DD/YYYY format. Ensure all payment amounts are formatted similarly, such as $10.00.
Set Up Your Excel Base Sheet: Enter all your collected data into an Excel spreadsheet. Organize it clearly, with columns for each data point: ‘Sign-up Date’, ‘Acquisition Source’, ‘Monthly Payment’, and ‘Churn Date’. Please note that you will also eventually need to understand the costs associated with each acquisition channel.
Example: In your Excel sheet, fill in each subscriber’s information under the respective headers in subsequent rows.
Document Marketing Costs: Please note that you will also need to understand the costs associated with each acquisition channel. We recommend documenting monthly spending by channel to start.
Example: In a separate Excel sheet, in each row document the promotional channel you are tracking (referral, organic, email, PPC, banner advertising, affiliate, direct response, etc ….), and then in each column document the spend for each month (PPC: January $1,520, February $1,037, etc…)
Excel Formulas for this step that may be helpful:
COUNTING: To count how many subscribers remain active in a given month: =COUNTIF(range, criteria)
DATEVALUE: Converts a date in the form of text to a serial number that Excel recognizes as a date: =DATEVALUE(“01/31/2023”)
TEXT: Converts a value to text in a specified number format; useful for standardizing currency or date formats: =TEXT(A2, “$#,##0.00”) =TEXT(B2, “mm/dd/yyyy”)
Remember the People this Data Represents Treat your data with care, as each entry represents a person who’s chosen to spend money with your brand and be part of your subcsription’s journey.
Step 2: Building Your LTV Cohort Analysis Framework
Create the foundation essential for building more complex reports.
Segment Your Subscribers: Group your subscribers based on their sign-up date to form monthly cohorts based on start date.
Example: All subscribers who joined (started) in January 2023 form one cohort that you will ultimately look at retention over time, total lifetime revenue and cost. You will do the same for those starting in February 2023, and so on.
Construct Your Cohort Grid: Create a new sheet in Excel. Draft a grid where each ROW represents a different START DATE cohort (January 2023) and each COLUMN represents RETENTION, that is, the subsequent time period since signing up (Month 1, Month 2, etc.). that counts how many subscribers remain as subscribers churn out).
Example: Your rows will be labels by start date, ‘January 2023’, ‘February 2023’, etc ….). Label the first COLUMN (after the cohort names) as ‘Month 0’ to represent the subscription starts, and then ‘Month 1’, ‘Month 2’, continuing as needed across the sheet to count how many subscribers RENEWED each month since their respective start date.
Initialize With Subscriber Counts: Populate your grid with the initial count of new subscribers for each ‘Start date’ cohort in the ‘Month 0’ column. Then record how many remain active in the following months.
Example: If 50 subscribers signed up in January 2023, place ’50’ under ‘Month 0’ next to the January cohort. If 40 remain after their first renewal in ‘Month 1′, enter ’40’ in the corresponding cell.
Excel Formulas for this step that may be helpful:
COUNTIF: Useful for initializing subscriber counts in your cohorts based on specific criteria, such as counting how many subscribers signed up in a particular month: =COUNTIF(SignUpDates, “01/2023”)
Get Creative and Colorful! Personalize your Excel sheet to reflect your brand or use color coding to differentiate between cohorts for easier reading and analysis.
Step 3: Calculating Average Lifetime Value
Understand subscriber value over time.
Determine Monthly Revenue Per Subscriber: Calculate how much each subscriber cohort brings in on average each month.
Example: If your January 2023 cohort generated $500 in its initial month from 50 subscribers, then the average monthly revenue per subscriber for that month is $10.
Monitor Revenue Growth Over Time: Note the revenue generated by each cohort in subsequent months to assess their growth and longevity.
Example: Continue to track and enter the monthly revenue figures for the January cohort for Renewal Month 1, Month 2, and beyond.
Calculate Cohort LTV: Divide the total revenue for each cohort (Start date)by the initial number of subscribers to determine their LTV over different periods.
Example: If by Renewal Month 4, the January 2023 cohort has generated a total of $2,000 from the original 50 subscribers, the LTV per subscriber at this point is $40.
Excel Formulas for this step that may be helpful:
AVERAGEIF(S): Calculates the average of numbers based on a condition. This is useful for finding the average revenue per subscriber in a specific cohort: =AVERAGEIFS(MonthlyPayments, SignUpMonths, “=January 2023”)
SUMIFS: Adds the cells specified by a given set of conditions or criteria. This can help tally the total revenue for a cohort over time: =SUMIFS(RevenueRange, CohortRange, “=January 2023”, MonthRange, “=Month 1”)
REVENUE PER SUBSCRIBER: To calculate monthly revenue per subscriber, use: =SUM(Total Revenue for Month)/COUNT(Active Subscribers). Then, extend this formula over time to see how LTV evolves.
Take a Reflective Pause: Remember, these numbers reflect the choices and experiences of real people. Understanding their value helps you serve them better.
Compare the effectiveness of different subscriber acquisition channels to optimize marketing budgets.
Segment Data by Acquisition Source: Further break down each cohort (Start Month) by the method through which the subscribers were acquired.
Example: Split the January 2023 cohort into groups based on their acquisition sources, such as Google ads versus TV ads.
Determine Channel-Specific LTV: Evaluate the LTV for each acquisition channel within the cohorts.
Example: If the LTV for subscribers acquired via Google ads is $60, while for those from TV ads, it’s $40, this indicates the relative effectiveness of these channels.
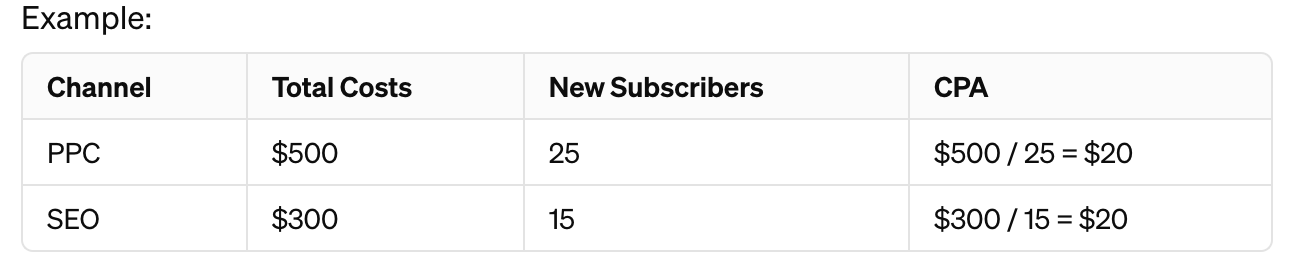
Analyze Costs Versus Returns: Assess the profitability of different acquisition channels by comparing the cost per acquisition (CPA) with the LTV.
Example: If acquiring a subscriber through Google ads costs $30 and their LTV is $60, the investment is profitable.
Excel Formulas for this step that may be helpful:
PROFITABILITY: Evaluate LTV against acquisition costs by channel. Use =LTV – CPA (Cost Per Acquisition) for a straightforward profitability metric.
COST PER ACQUISITION (CPA): For each channel, divide the total cost by the number of new subscribers (acquisitions) from that channel: =TotalCosts / NewSubscribers
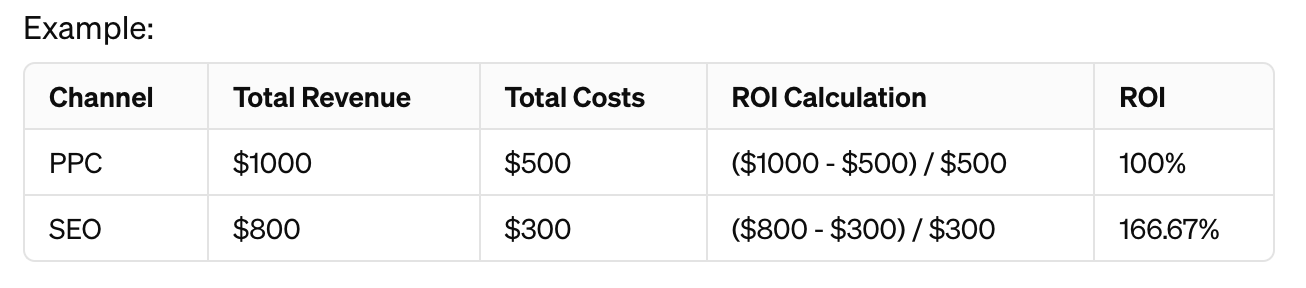
RETURN ON INVESTMENT (ROI): For each channel, subtract the total costs from the total revenue generated by the subscribers acquired through that channel, then divide by the total costs: =(TotalRevenue – TotalCosts) / TotalCosts
SUMPRODUCT / COUNTIF: Combines conditions to compute more complex metrics like total revenue per acquisition channel: =SUMPRODUCT((AcquisitionChannels=”Google Ads”) * (MonthlyRevenue)) / COUNTIF(AcquisitionChannels, “Google Ads”)
VLOOKUP / HLOOKUP: Useful for pulling in associated costs or data from different tables based on acquisition channel or subscriber ID.: =VLOOKUP(“Google Ads”, ChannelCostsTable, 2, FALSE)
Never Forget: Behind every data point is an individual’s decision influenced by your brand’s message, presence, and value to them.
Step 5: Visualizing the Data
Enable quicker and more informed decision-making.
Chart LTV Trends: Utilize Excel’s chart features to visually represent the LTV over time for each cohort. This makes it easier to understand trends and compare performance among different groups.
Example: Create a line chart with the x-axis representing the months since sign-up (Month 1, Month 2, etc.) and the y-axis representing the LTV. Plot different lines for each cohort to visually compare their value over time. Additionally, create an average line that represents the overall average LTV across all cohorts for comparative analysis.
Compare Channel Effectiveness: Use visual tools like bar charts or line charts to compare the effectiveness and cost-efficiency of different acquisition channels within each cohort.
Example: Construct a bar chart where each bar represents a different acquisition source and its corresponding average LTV. This visual comparison will help you identify which channels are generating the most valuable subscribers.
Excel Formulas for this step that may be helpful:
SUBTOTAL: Function for calculating sum, average, count, etc., while ignoring hidden rows. Useful for preparing data to be graphed, especially if filtering data: =SUBTOTAL(9, RevenueRange)
Embrace Visualization: Craft a line chart to depict LTV growth over time for each cohort, or try a bar chart comparing the effectiveness of different acquisition channels. Use what works for you, your team, and your business!
Step 6: Insights into Action
Optimize programs and drive targeted improvements based on evidence, not opinion.
Your goal with your team here is to not ONLY understand the most profitable subscriber acquisition channels but to ALSO adjust your investment for EACH channel based on that channel’s profitability. Putting this data into action means setting benchmarks or target CPAs based on LTV and desired profit margins for different acquisition channels or the maximum CPA per subscriber acquisition channel to achieve profitable growth for your business.
Identify High-Performing Channels: Analyze your charts and reports to determine which acquisition channels are bringing in subscribers with the highest LTV. These are your most effective channels.
Example: If the analysis shows that subscribers acquired through referral programs have a higher LTV compared to those from paid ads, then focusing more resources on your referral program could be advantageous.
Spot Trends and Address Issues: Look for patterns in the data that could indicate opportunities or challenges, such as seasonal variations in subscriber growth or higher churn rates from certain channels.
Example: If you notice a spike in churn rates for cohorts acquired during a particular season, investigate further to understand the cause and address it.
Make Informed Strategic Decisions: Use the insights gained from your cohort analysis to inform your marketing strategies, budget allocation, and overall business decisions.
Example: Allocate more of your marketing budget to the channels that have proven to generate subscribers with the highest LTV, and consider reducing spend or optimizing strategies for underperforming channels.
Regular Review and Adaptation: Continuously update your cohort analysis with new data and review it regularly to ensure your strategies remain aligned with the changing dynamics of your subscriber base and market conditions.
Example: Set a recurring schedule, such as monthly or quarterly, to update and review your cohort reports. Use these reviews to adjust your marketing strategies in response to new trends or insights.
Excel Formulas for this step that may be helpful:
DESIRED MARGIN: This is the percentage of the LTV that you are willing to spend on acquiring a new subscriber while maintaining profitability. This is a trick question, ask your CMO and CFO what you % should utilize!
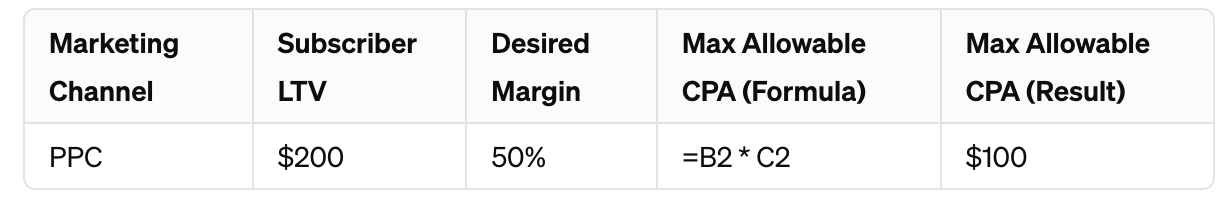
MAXIMUM ALLOWABLE CPA: This is the maximum amount you can spend to acquire a subscriber while adhering to your desired margin. Formula: =LTV * Desired Margin
If the LTV for a PPC subscriber is $200 and you want to maintain a 50% margin, the formula in Excel would look like this: =$200 * 50%
This calculation would result in a maximum allowable CPA of $100. This means for every dollar spent on acquiring a subscriber through PPC, you should not exceed $100 to maintain your desired margin.
Here is how you could set this up in an Excel spreadsheet: Replace B2 with the cell containing the LTV for PPC subscribers, and C2 with the cell containing your desired margin (expressed as a percentage). This setup will allow you to quickly see the maximum amount you can afford to spend to acquire a subscriber through each of your marketing channels while maintaining your profitability targets.
Don’t Forget Continuous Engagement! Keep your analysis current by regularly revisiting and updating your data. As your business evolves, so too will your insights and strategies.
Conclusion
By methodically examining and understanding the lifetime value and profitability of your subscribers based on their acquisition source, you not only sharpen your marketing focus but also enhance your business’s financial health.
Remember, the landscape of subscriber preferences and behaviors is ever-changing. Therefore, treat this cohort analysis not as a one-time task but as an ongoing strategic practice. Regularly revisiting and updating your analysis will ensure your strategies remain relevant and effective, keeping your subscription business on a path of sustainable growth and profitability. Embrace the insights, adapt to the trends, and watch your business thrive.
Kathy Greenler Sexton is the CEO & Publisher of Subscription Insider, a digital media company that delivers intelligence on how to build, market and sell subscription-based products and services.(www.subscriptioninsider.com) She is a recognized expert in digital subscription business models, market strategy, brand development, and digital information products.
Prior to Subscription Insider, Kathy led the SIIA Content Division as its VP & General Manager growing membership and revenue while helping media, publishing and information companies navigate the dramatic changes in content creation, business models, and technology.
Kathy played key executive roles in the successful sale of Individual.com, NewsAlert/ Inlumen, and HighBeam Research. She launched and led the growth of leading digital brands including AltaVista, Individual.com, and HighBeam Research. She also executed turn-around and new-to-market solutions for SIIA, ZoomInfo, Business & Legal Resources, Inlumen, and OrderMotion.
Kathy is a frequent speaker at industry conferences on the Subscription Economy. She lives in the greater-Boston area with her husband and son is an avid skier and Boston sports fan.
Do you understand laws targeting your subscription business? We invite you to check
Log In
Join Subscription Insider!
Get unlimited access to info, strategy, how-to content, trends, training webinars, and 10 years of archives on growing a profitable subscription business. We cover the unique aspects of running a subscription business including compliance, payments, marketing, retention, market strategy and even choosing the right tech.